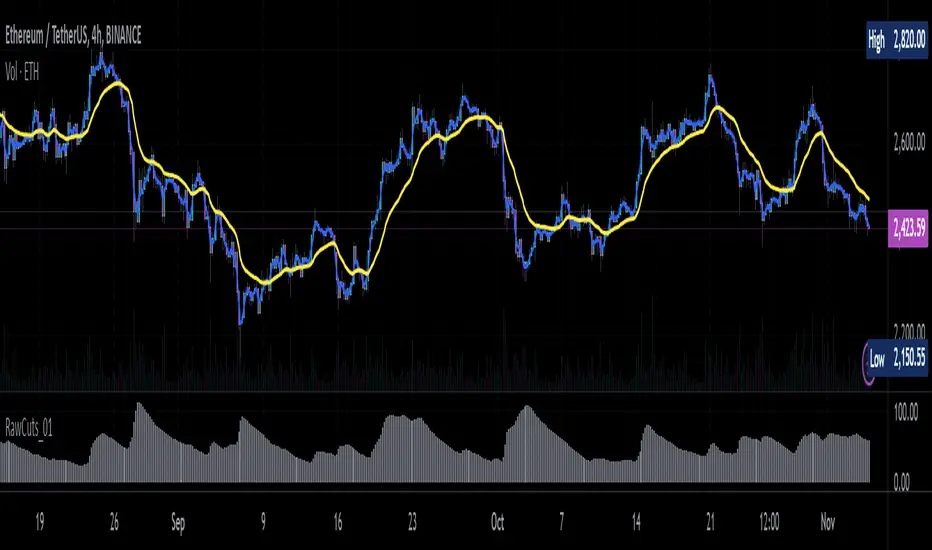
RawCuts_01Library "RawCuts_01"
A collection of functions by:
mutantdog
The majority of these are used within published projects, some useful variants have been included here aswell.
This is volume one consisting mainly of smaller functions, predominantly the filters and standard deviations from Weight Gain 4000.
Also included at the bottom are various snippets of related code for demonstration. These can be copied and adjusted according to your needs.
A full up-to-date table of contents is located at the top of the main script.
WEIGHT GAIN FILTERS
A collection of moving average type filters with adjustable volume weighting.
Based upon the two most common methods of volume weighting.
'Simple' uses the standard method in which a basic VWMA is analogous to SMA.
'Elastic' uses exponential method found in EVWMA which is analogous to RMA.
Volume weighting is applied according to an exponent multiplier of input volume.
0 >> volume^0 (unweighted), 1 >> volume^1 (fully weighted), use float values for intermediate weighting.
Additional volume filter switch for smoothing of outlier events.
DIVA MODULAR DEVIATIONS
A small collection of standard and absolute deviations.
Includes the weightgain functionality as above.
Basic modular functionality for more creative uses.
Optional input (ct) for external central tendency (aka: estimator).
Can be assigned to alternative filter or any float value. Will default to internal filter when no ct input is received.
Some other useful or related functions included at the bottom along with basic demonstration use.
weightgain_sma(src, len, xVol, fVol)
Simple Moving Average (SMA): Weight Gain (Simple Volume).
Parameters:
src (float) : Source input.
len (int) : Length (number of bars).
xVol (float) : Volume exponent multiplier (0 = unweighted, 1 = fully weighted).
fVol (bool) : Volume smoothing filter.
Returns: Standard Simple Moving Average with Simple Weight Gain applied.
weightgain_hsma(src, len, xVol, fVol)
Harmonic Simple Moving Average (hSMA): Weight Gain (Simple Volume).
Parameters:
src (float) : Source input.
len (int) : Length (number of bars).
xVol (float) : Volume exponent multiplier (0 = unweighted, 1 = fully weighted).
fVol (bool) : Volume smoothing filter.
Returns: Harmonic Simple Moving Average with Simple Weight Gain applied.
weightgain_gsma(src, len, xVol, fVol)
Geometric Simple Moving Average (gSMA): Weight Gain (Simple Volume).
Parameters:
src (float) : Source input.
len (int) : Length (number of bars).
xVol (float) : Volume exponent multiplier (0 = unweighted, 1 = fully weighted).
fVol (bool) : Volume smoothing filter.
Returns: Geometric Simple Moving Average with Simple Weight Gain applied.
weightgain_wma(src, len, xVol, fVol)
Linear Weighted Moving Average (WMA): Weight Gain (Simple Volume).
Parameters:
src (float) : Source input.
len (int) : Length (number of bars).
xVol (float) : Volume exponent multiplier (0 = unweighted, 1 = fully weighted).
fVol (bool) : Volume smoothing filter.
Returns: Basic Linear Weighted Moving Average with Simple Weight Gain applied.
weightgain_hma(src, len, xVol, fVol)
Hull Moving Average (HMA): Weight Gain (Simple Volume).
Parameters:
src (float) : Source input.
len (int) : Length (number of bars).
xVol (float) : Volume exponent multiplier (0 = unweighted, 1 = fully weighted).
fVol (bool) : Volume smoothing filter.
Returns: Basic Hull Moving Average with Simple Weight Gain applied.
diva_sd_sma(src, len, xVol, fVol, ct)
Standard Deviation (SD SMA): Diva / Weight Gain (Simple Volume)
Parameters:
src (float) : Source input.
len (int) : Length (number of bars).
xVol (float) : Volume exponent multiplier (0 = unweighted, 1 = fully weighted).
fVol (bool) : Volume smoothing filter.
ct (float) : Central tendency (optional, na = bypass). Internal: weightgain_sma().
Returns:
diva_sd_wma(src, len, xVol, fVol, ct)
Standard Deviation (SD WMA): Diva / Weight Gain (Simple Volume).
Parameters:
src (float) : Source input.
len (int) : Length (number of bars).
xVol (float) : Volume exponent multiplier (0 = unweighted, 1 = fully weighted).
fVol (bool) : Volume smoothing filter.
ct (float) : Central tendency (optional, na = bypass). Internal: weightgain_wma().
Returns:
diva_aad_sma(src, len, xVol, fVol, ct)
Average Absolute Deviation (AAD SMA): Diva / Weight Gain (Simple Volume).
Parameters:
src (float) : Source input.
len (int) : Length (number of bars).
xVol (float) : Volume exponent multiplier (0 = unweighted, 1 = fully weighted).
fVol (bool) : Volume smoothing filter.
ct (float) : Central tendency (optional, na = bypass). Internal: weightgain_sma().
Returns:
diva_aad_wma(src, len, xVol, fVol, ct)
Average Absolute Deviation (AAD WMA): Diva / Weight Gain (Simple Volume) .
Parameters:
src (float) : Source input.
len (int) : Length (number of bars).
xVol (float) : Volume exponent multiplier (0 = unweighted, 1 = fully weighted).
fVol (bool) : Volume smoothing filter.
ct (float) : Central tendency (optional, na = bypass). Internal: weightgain_wma().
Returns:
weightgain_ema(src, len, xVol, fVol)
Exponential Moving Average (EMA): Weight Gain (Elastic Volume).
Parameters:
src (float) : Source input.
len (int) : Length (number of bars).
xVol (float) : Volume exponent multiplier (0 = unweighted, 1 = fully weighted).
fVol (bool) : Volume smoothing filter.
Returns: Exponential Moving Average with Elastic Weight Gain applied.
weightgain_dema(src, len, xVol, fVol)
Double Exponential Moving Average (DEMA): Weight Gain (Elastic Volume).
Parameters:
src (float) : Source input.
len (int) : Length (number of bars).
xVol (float) : Volume exponent multiplier (0 = unweighted, 1 = fully weighted).
fVol (bool) : Volume smoothing filter.
Returns: Double Exponential Moving Average with Elastic Weight Gain applied.
weightgain_tema(src, len, xVol, fVol)
Triple Exponential Moving Average (TEMA): Weight Gain (Elastic Volume).
Parameters:
src (float) : Source input.
len (int) : Length (number of bars).
xVol (float) : Volume exponent multiplier (0 = unweighted, 1 = fully weighted).
fVol (bool) : Volume smoothing filter.
Returns: Triple Exponential Moving Average with Elastic Weight Gain applied.
weightgain_rma(src, len, xVol, fVol)
Rolling Moving Average (RMA): Weight Gain (Elastic Volume).
Parameters:
src (float) : Source input.
len (int) : Length (number of bars).
xVol (float) : Volume exponent multiplier (0 = unweighted, 1 = fully weighted).
fVol (bool) : Volume smoothing filter.
Returns: Rolling Moving Average with Elastic Weight Gain applied.
weightgain_drma(src, len, xVol, fVol)
Double Rolling Moving Average (DRMA): Weight Gain (Elastic Volume).
Parameters:
src (float) : Source input.
len (int) : Length (number of bars).
xVol (float) : Volume exponent multiplier (0 = unweighted, 1 = fully weighted).
fVol (bool) : Volume smoothing filter.
Returns: Double Rolling Moving Average with Elastic Weight Gain applied.
weightgain_trma(src, len, xVol, fVol)
Triple Rolling Moving Average (TRMA): Weight Gain (Elastic Volume).
Parameters:
src (float) : Source input.
len (int) : Length (number of bars).
xVol (float) : Volume exponent multiplier (0 = unweighted, 1 = fully weighted).
fVol (bool) : Volume smoothing filter.
Returns: Triple Rolling Moving Average with Elastic Weight Gain applied.
diva_sd_ema(src, len, xVol, fVol, ct)
Standard Deviation (SD EMA): Diva / Weight Gain: (Elastic Volume).
Parameters:
src (float) : Source input.
len (int) : Length (number of bars).
xVol (float) : Volume exponent multiplier (0 = unweighted, 1 = fully weighted).
fVol (bool) : Volume smoothing filter.
ct (float) : Central tendency (optional, na = bypass). Internal: weightgain_ema().
Returns:
diva_sd_rma(src, len, xVol, fVol, ct)
Standard Deviation (SD RMA): Diva / Weight Gain: (Elastic Volume).
Parameters:
src (float) : Source input.
len (int) : Length (number of bars).
xVol (float) : Volume exponent multiplier (0 = unweighted, 1 = fully weighted).
fVol (bool) : Volume smoothing filter.
ct (float) : Central tendency (optional, na = bypass). Internal: weightgain_rma().
Returns:
weightgain_vidya_rma(src, len, xVol, fVol)
VIDYA v1 RMA base (VIDYA-RMA): Weight Gain (Elastic Volume).
Parameters:
src (float) : Source input.
len (int) : Length (number of bars).
xVol (float) : Volume exponent multiplier (0 = unweighted, 1 = fully weighted).
fVol (bool) : Volume smoothing filter.
Returns: VIDYA v1, RMA base with Elastic Weight Gain applied.
weightgain_vidya_ema(src, len, xVol, fVol)
VIDYA v1 EMA base (VIDYA-EMA): Weight Gain (Elastic Volume).
Parameters:
src (float) : Source input.
len (int) : Length (number of bars).
xVol (float) : Volume exponent multiplier (0 = unweighted, 1 = fully weighted).
fVol (bool) : Volume smoothing filter.
Returns: VIDYA v1, EMA base with Elastic Weight Gain applied.
diva_sd_vidya_rma(src, len, xVol, fVol, ct)
Standard Deviation (SD VIDYA-RMA): Diva / Weight Gain: (Elastic Volume).
Parameters:
src (float) : Source input.
len (int) : Length (number of bars).
xVol (float) : Volume exponent multiplier (0 = unweighted, 1 = fully weighted).
fVol (bool) : Volume smoothing filter.
ct (float) : Central tendency (optional, na = bypass). Internal: weightgain_vidya_rma().
Returns:
diva_sd_vidya_ema(src, len, xVol, fVol, ct)
Standard Deviation (SD VIDYA-EMA): Diva / Weight Gain: (Elastic Volume).
Parameters:
src (float) : Source input.
len (int) : Length (number of bars).
xVol (float) : Volume exponent multiplier (0 = unweighted, 1 = fully weighted).
fVol (bool) : Volume smoothing filter.
ct (float) : Central tendency (optional, na = bypass). Internal: weightgain_vidya_ema().
Returns:
weightgain_sema(src, len, xVol, fVol)
Parameters:
src (float)
len (simple int)
xVol (float)
fVol (bool)
diva_sd_sema(src, len, xVol, fVol)
Parameters:
src (float)
len (simple int)
xVol (float)
fVol (bool)
diva_mad_mm(src, len, ct)
Median Absolute Deviation (MAD MM): Diva (no volume weighting).
Parameters:
src (float) : Source input.
len (int) : Length (number of bars).
ct (float) : Central tendency (optional, na = bypass). Internal: ta.median()
Returns:
source_switch(slct, aux1, aux2, aux3, aux4)
Custom Source Selector/Switch function. Features standard & custom 'weighted' sources with additional aux inputs.
Parameters:
slct (string) : Choose from custom set of string values.
aux1 (float) : Additional input for user-defined source, eg: standard input.source(). Optional, use na to bypass.
aux2 (float) : Additional input for user-defined source, eg: standard input.source(). Optional, use na to bypass.
aux3 (float) : Additional input for user-defined source, eg: standard input.source(). Optional, use na to bypass.
aux4 (float) : Additional input for user-defined source, eg: standard input.source(). Optional, use na to bypass.
Returns: Float value, to be used as src input for other functions.
colour_gradient_ma_div(ma1, ma2, div, bull, bear, mid, mult)
Colour Gradient for plot fill between two moving averages etc, with seperate bull/bear and divergence strength.
Parameters:
ma1 (float) : Input for fast moving average (eg: bullish when above ma2).
ma2 (float) : Input for slow moving average (eg: bullish when below ma1).
div (float) : Input deviation/divergence value used to calculate strength of colour.
bull (color) : Colour when ma1 above ma2.
bear (color) : Colour when ma1 below ma2.
mid (color) : Neutral colour when ma1 = ma2.
mult (int) : Opacity multiplier. 100 = maximum, 0 = transparent.
Returns: Colour with transparency (according to specified inputs)
스크립트에서 "Exponential Moving Average"에 대해 찾기
Trend Strength with Volatility and Volume [ST]Trend Strength with Volatility and Volume
Description in English:
This indicator combines market volatility and trading volume to measure the current trend strength. It helps identify when the trend is gaining or losing momentum.
Detailed Explanation:
Configuration:
Length: This input defines the period over which the moving average is calculated. The default value is 14.
MA Type: This input allows you to choose between a Simple Moving Average (SMA) and an Exponential Moving Average (EMA).
Volatility Length: This input defines the period over which the ATR (Average True Range) is calculated. The default value is 14.
Volume Length: This input defines the period over which the moving average of volume is calculated. The default value is 14.
Trend Strength Calculation:
Moving Average (MA): The script calculates the moving average of the closing price based on the selected type (SMA or EMA) and period.
Volatility (ATR): The ATR is used to measure market volatility over the specified period.
Volume MA: The script calculates the moving average of the trading volume based on the selected type (SMA or EMA) and period.
Trend Strength: The trend strength is calculated as the difference between the closing price and the moving average, divided by the volatility, and multiplied by the volume normalized by its moving average.
Plotting:
The trend strength is plotted as a line chart. Positive values indicate a strong upward trend, while negative values indicate a strong downward trend.
A horizontal line is added at the zero level to help identify the neutral point.
Indicator Benefits:
Trend Identification: Helps traders identify the strength of the current trend by combining price, volatility, and volume.
Visual Cues: Provides clear visual signals for trend strength, aiding in making informed trading decisions.
Customizable Parameters: Allows traders to adjust the length of the moving averages, ATR, and volume to suit different trading strategies and market conditions.
Justification of Component Combination:
Combining price, volatility, and volume provides a comprehensive measure of trend strength. This combination enhances the trader's ability to make informed decisions based on multiple market factors.
How Components Work Together:
The script calculates the moving average of the closing price and trading volume.
It measures market volatility using the ATR.
The trend strength is calculated by combining these components, providing a robust measure of the current trend's strength.
Título: Força da Tendência com Volatilidade e Volume
Descrição em Português:
Este indicador combina a volatilidade do mercado, medida pelo ATR (Average True Range), e o volume de negociações para medir a força da tendência atual. Ele ajuda a identificar quando a tendência está ganhando ou perdendo força.
Explicação Detalhada:
Configuração:
Comprimento: Este parâmetro define o período para o cálculo da média móvel. O valor padrão é 14.
Tipo de MA: Este parâmetro permite escolher entre uma Média Móvel Simples (SMA) e uma Média Móvel Exponencial (EMA).
Comprimento da Volatilidade: Este parâmetro define o período para o cálculo do ATR (Average True Range). O valor padrão é 14.
Comprimento do Volume: Este parâmetro define o período para o cálculo da média móvel do volume. O valor padrão é 14.
Cálculo da Força da Tendência:
Média Móvel (MA): O indicador calcula a média móvel do preço de fechamento com base no tipo selecionado (SMA ou EMA) e período.
Volatilidade (ATR): O ATR é usado para medir a volatilidade do mercado ao longo do período especificado.
Média Móvel do Volume: O indicador calcula a média móvel do volume de negociação com base no tipo selecionado (SMA ou EMA) e período.
Força da Tendência: A força da tendência é calculada como a diferença entre o preço de fechamento e a média móvel, dividida pela volatilidade e multiplicada pelo volume normalizado pela sua média móvel.
Plotagem:
A força da tendência é plotada como um gráfico de linhas. Valores positivos indicam uma forte tendência de alta, enquanto valores negativos indicam uma forte tendência de baixa.
Uma linha horizontal é adicionada no nível zero para ajudar a identificar o ponto neutro.
Benefícios do Indicador:
Identificação de Tendências: Este indicador ajuda os traders a identificar a força da tendência atual, combinando preço, volatilidade e volume.
Sinais Visuais Claros: Fornece sinais visuais claros para a força da tendência, facilitando a tomada de decisões informadas.
Parâmetros Personalizáveis: Os traders podem ajustar o comprimento das médias móveis, ATR e volume para se adequar a diferentes estratégias de negociação e condições de mercado.
Justificação da Combinação de Componentes:
A combinação de preço, volatilidade e volume fornece uma medida abrangente da força da tendência.
Isso melhora a capacidade dos traders de tomar decisões informadas com base em múltiplos fatores do mercado.
Como os Componentes Funcionam Juntos:
O indicador calcula a média móvel do preço de fechamento e do volume de negociação.
Mede a volatilidade do mercado usando o ATR.
A força da tendência é calculada combinando esses componentes, fornecendo uma medida robusta da força da tendência atual.

Combined IndicatorSummary
This custom Pine Script combines three main indicators into one, each with its own functionalities and visual cues. It provides a comprehensive approach to trend analysis by integrating short-term, medium-term, and long-term indicators. Each part of the indicator can be toggled on or off independently to suit the trader’s needs.
Part 1: EMA 14 and EMA 200
Purpose: This part of the indicator is designed to identify short-term and long-term trends using Exponential Moving Averages (EMA). It helps traders spot potential entry and exit points based on the relationship between short-term and long-term moving averages.
Visuals:
• EMA 14: Plotted in blue (#2962ff)
• EMA 200: Plotted in red (#f23645)
Signals:
• Long Signal: Generated when EMA 14 crosses above EMA 200, indicating a potential upward trend.
• Short Signal: Generated when EMA 14 crosses below EMA 200, indicating a potential downward trend.
Usage: Toggle this part on or off using the checkbox input to focus on short-term vs. long-term trends.
Part 2: EMA 9 and SMA 20
Purpose: This part combines Exponential and Simple Moving Averages to provide a medium-term trend analysis. It helps smooth out price data and identify potential trend reversals and continuation patterns.
Visuals:
• EMA 9: Plotted in green
• SMA 20: Plotted in dark red
Usage: Toggle this part on or off using the checkbox input to focus on medium-term trends and price smoothing.
Part 3: Golden Cross and Death Cross
Purpose: This part identifies long-term bullish and bearish market conditions using the 50-day and 200-day Simple Moving Averages (SMA). It highlights major trend changes that can inform long-term investment decisions.
Visuals:
• 50-day SMA: Plotted in gold (#ffe600)
• 200-day SMA: Plotted in black
Signals:
• Golden Cross: Generated when the 50-day SMA crosses above the 200-day SMA, indicating a potential long-term upward trend.
• Death Cross: Generated when the 50-day SMA crosses below the 200-day SMA, indicating a potential long-term downward trend.
Usage: Toggle this part on or off using the checkbox input to focus on long-term trend changes.
How to Use
1. Enable/Disable Indicators: Use the checkboxes provided in the input settings to enable or disable each part of the indicator according to your analysis needs.
2. Interpret Signals: Look for crossover events to determine potential entry and exit points based on the relationship between the moving averages.
3. Visual Confirmation: Use the color-coded lines and shape markers on the chart to visually confirm signals and trends.
4. Customize Settings: Adjust the lengths of the EMAs and SMAs in the input settings to suit your trading strategy and the specific asset you are analyzing.
Practical Application
• Short-Term Trading: Use the EMA 14 and EMA 200 signals to identify quick trend changes.
• Medium-Term Trading: Use the EMA 9 and SMA 20 to capture medium-term trends and reversals.
• Long-Term Investing: Monitor the Golden Cross and Death Cross signals to make decisions based on long-term trend changes.
Example of Unique Features
• Integrated Toggle System: Allows users to enable or disable specific parts of the indicator to customize their analysis.
• Multi-Tier Trend Analysis: Combines short-term, medium-term, and long-term indicators to provide a comprehensive view of the market.

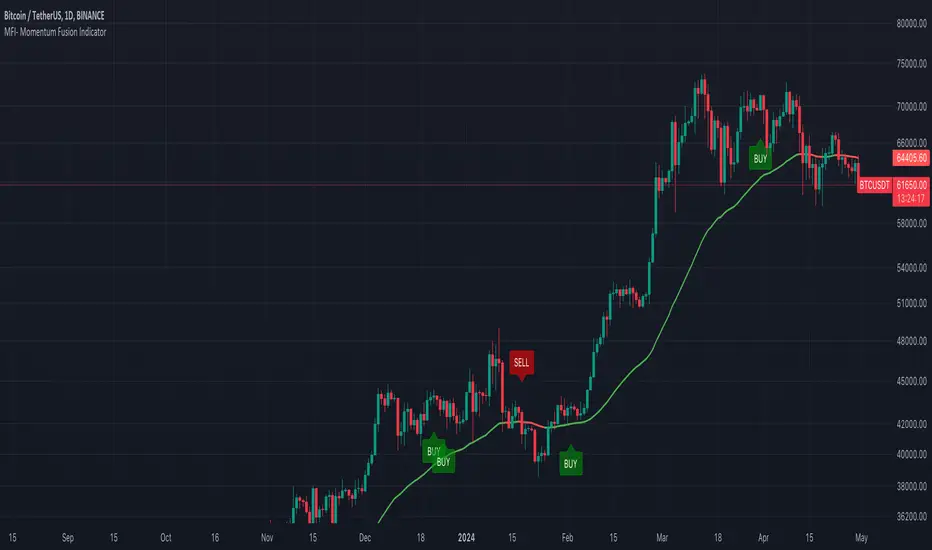
MFI- Momentum Fusion IndicatorIndicator Overview
The "MFI - Momentum Fusion Indicator" is a comprehensive trading tool designed for TradingView that combines several technical analysis methods to assist traders in identifying potential buy and sell opportunities in financial markets.
Key Components
Moving Averages (MA): Uses two Simple Moving Averages (SMA) with periods defined by the user (default 10 and 20). The indicator generates buy signals when the shorter MA (MA 10) crosses above the longer MA (MA 20) and sell signals when it crosses below, helping to pinpoint trend reversals.
Relative Strength Index (RSI): A momentum oscillator that helps identify overbought or oversold conditions, adding a layer of confirmation to the signals generated by the moving averages.
Exponential Moving Average (EMA 50): Used to gauge the medium-term trend direction. The color of the EMA line changes based on whether the trend is up (green) or down (red), providing a visual representation of the market trend.
Average True Range (ATR): This component measures market volatility. Signals are only generated when the ATR confirms significant market movement relative to the EMA50, enhancing the reliability of the signals during volatile conditions.
How It Works
Signal Generation: The core of the indicator is based on the crossover of two SMAs. A buy signal is issued when the short-term MA crosses above the long-term MA during sufficient market volatility (confirmed by ATR). Conversely, a sell signal is triggered when the short-term MA crosses below the long-term MA under similar conditions.
Trend Confirmation: The EMA50 helps confirm the broader market trend, while the ATR ensures that the crossover signals occur during periods of meaningful price movement, filtering out noise and less significant price movements.
Use Case
For Traders: The indicator is ideal for traders who need clear, actionable signals combined with an assessment of market conditions. It’s particularly useful in markets where understanding volatility and momentum is crucial, such as in cryptocurrencies and forex.
Benefits
Comprehensive Analysis: Combines trend, momentum, and volatility analysis in one tool, providing a multifaceted approach to the markets.
Enhanced Decision-Making: By integrating multiple indicators, it reduces the likelihood of false signals and enhances decision-making confidence.
Customizable and Dynamic: Allows for easy adjustment of parameters to fit different trading styles and market conditions.
This indicator equips traders with a powerful blend of tools to analyze price movements and make informed trading decisions based on a combination of trend, momentum, and volatility insights.
Johnny's Moving Average RibbonProps to Madrid for creating the original script: Madrid Moving Average Ribbon.
All I did was upgrade it to pinescript v5 and added a few changes to the script.
Features and Functionality
Moving Average Types: The indicator offers a choice between exponential moving averages (EMAs) and simple moving averages (SMAs), allowing users to select the type that best fits their trading strategy.
Dynamic Color Coding: Each moving average line within the ribbon changes color based on its direction and position relative to a reference moving average, providing visual cues for market sentiment and trend strength.
Lime Green: Indicates an uptrend and potential long positions, shown when a moving average is rising and above the longer-term reference MA.
Maroon: Suggests caution for long positions or potential short reentry points, displayed when a moving average is rising but below the reference MA.
Ruby Red: Represents a downtrend, suitable for short positions, shown when a moving average is falling and below the reference MA.
Green: Signals potential reentry points for downtrends or warnings for uptrend reversals, displayed when a moving average is falling but above the reference MA.
Usage and Application
Trend Identification: Traders can quickly ascertain the market's direction at a glance by observing the predominant color of the ribbon and its orientation.
Trade Entry and Exit Points: The color transitions within the ribbon can signal potential entry or exit points, with changes from green to lime or red to maroon indicating shifts in market momentum.
Customization: Users have the flexibility to toggle between exponential and simple moving averages, allowing for a tailored analytical approach that aligns with their individual trading preferences.
Technical Specifications
The ribbon consists of multiple moving averages calculated over different periods, typically ranging from shorter to longer-term intervals to capture various aspects of market behavior.
The color dynamics are determined by comparing each moving average to a reference point, often a longer-term moving average within the ribbon, to assess the relative trend strength and direction.

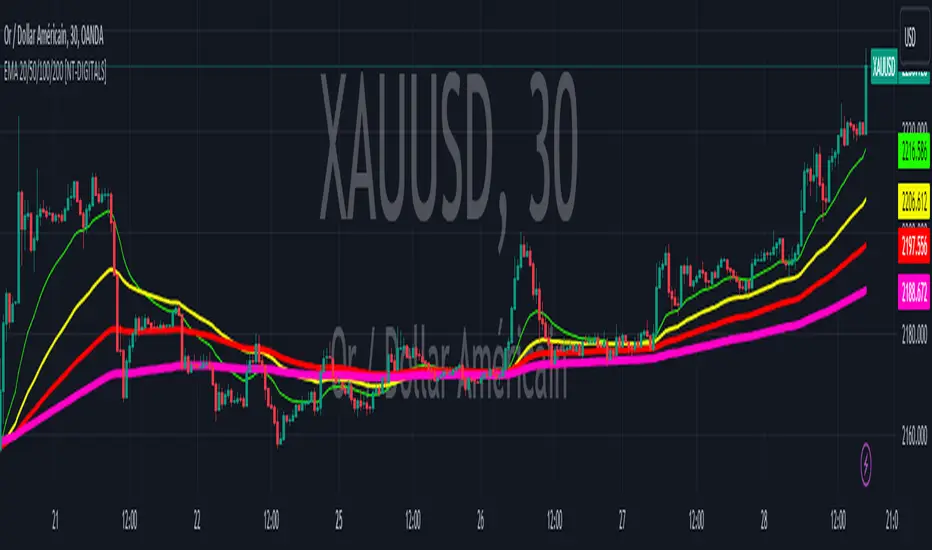
EMA 20/50/100/200 [NT-DIGITALS]This script plots Exponential Moving Averages (EMA) of 20, 50, 100, and 200 periods on the chart. EMAs are commonly used by traders to identify trends and potential reversal points in the market. The EMA smooths out price data to create a single line that follows the overall trend more closely than a simple moving average. By plotting multiple EMAs of different periods, traders can observe the interaction between short-term and long-term trends, aiding in decision-making for entry and exit points.
Exponential Moving Average (EMA) is a type of moving average that gives more weight to recent price data, making it more responsive to current price movements compared to a simple moving average (SMA). The EMA is calculated by applying a smoothing factor to the previous EMA value and adding a fraction of the difference between the current price and the previous EMA value. This weighting mechanism results in EMAs reacting more quickly to price changes, making them popular for traders looking to capture short-term trends in the market.
DEMA Adjusted Average True Range [BackQuant]The use of the Double Exponential Moving Average (DEMA) within your Adjusted Average True Range (ATR) calculation serves as a cornerstone for enhancing the indicator's responsiveness to market changes. To delve deeper into why DEMA is employed specifically in the context of your ATR calculation, let's explore the inherent qualities of DEMA and its impact on the ATR's performance.
DEMA and Its Advantages
As previously mentioned, DEMA was designed to offer a more responsive alternative to the traditional Exponential Moving Average (EMA). By giving more weight to recent price data, DEMA reduces the lag typically associated with moving averages. This reduction in lag is especially beneficial for short-term traders looking to capitalize on trend reversals and other market movements as swiftly as possible.
The calculation of DEMA involves the following steps:
Calculate EMA1: This is the Exponential Moving Average of the price.
Calculate EMA2: This is the Exponential Moving Average of EMA1, thus it is a smoothing of a smoothing, leading to a greater lag.
Formulate DEMA: The formula
EMA1 = EMA of price
EMA2 = EMA of EMA1
DEMA = (2 x EMA1) - EMA2
effectively doubles the weighting of the most recent data points by subtracting the lagged, double-smoothed EMA2 from twice the single-smoothed EMA1.
This process enhances the moving average's sensitivity to recent price movements, allowing the DEMA to adhere more closely to the price bars than either EMA1 or EMA2 alone.
Integration with ATR
In the context of your ATR calculation, the integration of DEMA plays a crucial role in defining the indicator's core functionality. Here's a detailed explanation of how DEMA affects the ATR calculation:
Initial Determination of DEMA : By applying the DEMA formula to the chosen source data (which can be adjusted to use Heikin Ashi candle close prices for an even smoother analysis), you set a foundation for a more reactive trend-following mechanism within the ATR framework.
Application to ATR Bands : The calculated DEMA serves as the central line from which the ATR bands are derived. The ATR value, multiplied by a user-defined factor, is added to and subtracted from the DEMA to form the upper and lower bands, respectively. This dynamic adjustment not only reflects the volatility based on the ATR but does so in a way that is closely aligned with the most recent price action, thanks to the utilization of DEMA.
Enhanced Signal Quality : The responsiveness of DEMA ensures that the ATR bands adjust more promptly to changes in market conditions. This quality is vital for traders who rely on the ATR bands to identify potential entry and exit points, trend reversals, or to assess market volatility.
By employing DEMA as the core component in calculating the Adjusted Average True Range, your indicator leverages DEMA's reduced lag and increased weight on recent data to provide a more timely and accurate measure of market volatility. This innovative approach enhances the utility of the ATR by making it not only a tool for assessing volatility but also a more reactive indicator for trend analysis and trading signal generation.
The main concept of combining these is to reduce lag, get a more robust signal and still capture clear trends over medium time horizons.
For me, this is best used in confluence with other indicators, it can be made faster in order to get fasters response time, or slower. This is all depending on the needs of you as a trader.
User Inputs:
The script offers several user-configurable inputs, such as the period lengths for DEMA and ATR calculations, the multiplication factor for the ATR, and options to use Heikin Ashi candles or standard price data. Additionally, it allows for the toggling of visual features, like the plotting of the DEMA ATR and its moving average, and the application of color-coded trends on price bars.
Additional Features:
Moving Average Confluence: Traders can opt to display a moving average of the DEMA ATR, choosing from various types (e.g., SMA, EMA, HMA). This feature provides a layer of confluence, aiding in the identification of trend direction and strength.
Trend Identification :
The script employs logical conditions to ascertain the trend direction based on the movement of the DEMA ATR. It assigns colors to represent bullish or bearish trends, which are reflected in the plotted lines and the coloring of price bars.
Alerts :
Customizable alert conditions for trend reversals enhance the utility of the indicator for active trading, notifying users of significant changes in trend direction.
1D Backtests
We include these backtests as a general proxy for how they work.
Please do your own calibrating to suit it to your own needs and backtest.
Past results don't = future results but they can help you understand how it functions.
INDEX:BTCUSD
INDEX:ETHUSD
BINANCE:SOLUSD

[blackcat] L1 Triple EMA ChannelHey, friends! blackcat is here to bring you an interesting and professional article today, talking about the "Triple Exponential Moving Average (TEMA) Channel" - a powerful tool as a trend indicator in volatile markets.
First of all, let's delve into the origins of the TEMA indicator. It was invented by Patrick Mulloy in the mid-90s with the aim to address the lagging issue encountered when using oscillators or Exponential Moving Averages (EMA). The TEMA indicator smooths out short-term fluctuations by utilizing multiple moving averages. What sets it apart is its unique approach of continuously using the EMA's EMA and adjusting for lag in its formula.
In this article, we will primarily focus on the functionality of the TEMA channel as a trend indicator. However, it's worth noting that its effectiveness is diminished in choppy or sideways markets. Instead, the TEMA indicator shines brightest in long-term trend trading. By utilizing TEMA, analysts can easily filter out and disregard periods of volatility, allowing them to focus on the overall trend.
To gain a comprehensive understanding of market trends, it is often recommended to combine TEMA with other oscillators or technical indicators. This combination can help traders and analysts interpret sharp price movements and assess the level of volatility. For example, some analysts suggest combining the Moving Average Convergence Divergence (MACD) with the TEMA channel to evaluate market trends more accurately.
Now, let's explore how the TEMA channel can be used as a tool to showcase interesting features of price support and resistance. In this script, the TEMA channel is represented by three bands: the upper band, the middle band, and the lower band. The upper band is depicted in white, the middle band in yellow, and the lower band in magenta.
So, let's dive deep into the world of the TEMA channel and enjoy the benefits it brings to understanding market trends. Join us on this exciting journey!

MACD Bands - Multi Timeframe [TradeMaster Lite]We present a customizable MACD indicator, with the following features:
Multi-timeframe
Deviation bands to spot unusual volatility
9 Moving Average types
Conditional coloring and line crossings
👉 What is MACD?
MACD is a classic, trend-following indicator that uses moving averages to identify changes in momentum. It can be used to identify trend changes, overbought and oversold conditions, and potential reversals.
👉 Multi-timeframe:
This feature allows to analyze the same market data on multiple time frames, which can be in help to identify trends and patterns that would not be visible on a single time frame. When using the multi-timeframe feature, it is important to start with the higher time frame and then look for confirmation on the lower time frames. This will help you to avoid false signals. Please note that only timeframes higher than the chart timeframe is supported currently with this feature enabled. Might get updated in the future.
👉 Deviation bands to spot unusual volatility:
Deviation bands are plotted around the Signal line that can be in help to identify periods of unusual volatility. When the MACD line crosses outside of the deviation bands, it suggests that the market is becoming more volatile and a strong trend may form in that direction.
👉 9 Moving Average types can be used in the script. Each type of moving average offers a unique perspective and can be used in different scenarios to identify market trends.
SMA (Simple Moving Average): This calculates the average of a selected range of values, by the number of periods in that range.
SMMA (Smoothed Moving Average): This takes into account all data available and assigns equal weighting to the values.
EMA (Exponential Moving Average): This places a greater weight and significance on the most recent data points.
DEMA (Double Exponential Moving Average): This is a faster-moving average that uses a proprietary calculation to reduce the lag in data points.
TEMA (Triple Exponential Moving Average): This is even quicker than the DEMA, helping traders respond more quickly to changes in trend.
LSMA (Least Squares Moving Average): This moving average applies least squares regression method to determine the future direction of the trend.
HMA (Hull Moving Average): This moving average is designed to reduce lag and improve smoothness, providing quicker signals for short-term market movements.
VWMA (Volume Weighted Moving Average): This assigns more weight to candles with a high volume, reflecting the true average values more accurately in high volume periods.
WMA (Weighted Moving Average): This assigns more weight to the latest data, but not as much as the EMA.
👉 Conditional coloring :
This feature colors the MACD line line based on it's direction and fills the area between the MACD line and Deviation band edges to highlight the potential volatility and the strength of the momentum. This can be useful to identify when the market is trending strongly and when it is in a more neutral or choppy state.
👉 MACD Line - Signal Line crossings:
This is a classic MACD trading signal that occurs when the MACD line crosses above or below the signal line. Crossovers can be used to identify potential trend reversals. This can be a bullish or bearish signal, depending on the direction of the crossover.
👉 General advice
Confirming Signals with other indicators:
As with all technical indicators, it is important to confirm potential signals with other analytical tools, such as support and resistance levels, as well as indicators like RSI, MACD, and volume. This helps increase the probability of a successful trade.
Use proper risk management:
When using this or any other indicator, it is crucial to have proper risk management in place. Consider implementing stop-loss levels and thoughtful position sizing.
Combining with other technical indicators:
The indicator can be effectively used alongside other technical indicators to create a comprehensive trading strategy and provide additional confirmation.
Keep in Mind:
Thorough research and backtesting are essential before making any trading decisions. Furthermore, it's crucial to have a solid understanding of the indicator and its behavior. Additionally, incorporating fundamental analysis and considering market sentiment can be vital factors to take into account in your trading approach.
Limitations:
This is a lagging indicator. Please note that the indicator is using moving averages, which are lagging indicators.
The indicators within the TradeMaster Lite package aim for simplicity and efficiency, while retaining their original purpose and value. Some settings, functions or visuals may be simpler than expected.
⭐ Conclusion
We hold the view that the true path to success is the synergy between the trader and the tool, contrary to the common belief that the tool itself is the sole determinant of profitability. The actual scenario is more nuanced than such an oversimplification. Our aim is to offer useful features that meet the needs of the 21st century and that we actually use.
🛑 Risk Notice:
Everything provided by trademasterindicator – from scripts, tools, and articles to educational materials – is intended solely for educational and informational purposes. Past performance does not assure future returns.

Dominant Period-Based Moving Average (DPBMA)Exploit Market Cycles with the Dominant Period-Based Moving Average Indicator
Introduction:
In the world of trading, market cycles play a crucial role in determining the rhythm of the market. These cycles often consist of recurring patterns that traders can exploit to maximize their profits. One effective way to capitalize on these cycles is by using a moving average (MA) indicator. Today, we are going to introduce you to a unique indicator that takes the most frequent dominant period of the market and uses it as the length of the moving average. This indicator is designed to adapt to the ever-changing market conditions, providing traders with a dynamic tool to better analyze the market.
Dominant Period-Based Moving Average Indicator Overview:
The Dominant Period-Based Moving Average (DPBMA) Indicator is a custom indicator designed to find the most frequent dominant period of the market and use that period as the length of the moving average. This innovative approach allows the indicator to adapt to the market cycles, making it more responsive to the market's changing conditions.
Here's a quick overview of the DPBMA Indicator's features:
Takes the most frequent dominant period of the market.
Uses the dominant period as the length of the moving average.
Adapts to the changing market cycles.
Works as an overlay on your price chart.
Using the Dominant Period-Based Moving Average Indicator:
How the Dominant Period-Based Moving Average Indicator Works:
The DPBMA Indicator works by first importing the DominantCycle function from the lastguru/DominantCycle/2 script. This function calculates the dominant cycle period of the given market data. The DPBMA Indicator then calculates the Exponential Moving Average (EMA) using the dominant period as the length parameter.
The EMA calculation uses an alpha factor, which is calculated as 2 / (length + 1). The alpha factor is then used to smooth the source data (closing prices) and calculate the adaptive moving average.
The DPBMA Indicator also includes a harmonic input, which allows you to multiply the dominant cycle period by an integer value. This can help you fine-tune the indicator to better fit your trading strategy or style.
The Raw Dominant Frequency:
The raw dominant frequency represents the primary cycle period present in the given market data. By identifying the raw dominant frequency, traders can gain insights into the market's current cycle and use this information to make informed trading decisions. The raw dominant frequency can be useful for detecting major trend reversals, support and resistance levels, and potential entry and exit points.
However, using the raw dominant frequency alone has its limitations. For instance, it may not always provide a clear picture of the market's prevailing trend, especially during periods of high market volatility. Additionally, relying solely on the raw dominant frequency may not capture the nuances of shorter-term cycles that can also impact price movements.
The Most Likely Dominant Frequency:
Our approach takes a different angle by focusing on the most likely dominant frequency. This method aims to identify the frequency with the highest probability of being the dominant frequency in the market data. The idea behind this approach is to filter out potential noise and improve the accuracy of the dominant frequency analysis. By using the most likely dominant frequency, traders can gain a more reliable understanding of the market's primary cycle, which can lead to better trading decisions.
In our Dominant Period-Based Moving Average Indicator, we calculate the most likely dominant frequency by analyzing an array of cycle periods and their occurrences in the given market data. We then determine the cycle period with the highest occurrence, representing the most likely dominant frequency. This method allows the indicator to be more adaptive and responsive to the changing market conditions, capturing the nuances of both long-term and short-term cycles.
Why Not the Average Dominant Frequency?
While using the average dominant frequency might seem like a reasonable approach, it can be less effective in accurately capturing the market's primary cycle. Averaging the dominant frequencies may dilute the impact of the true dominant frequency, resulting in a less accurate representation of the market's current cycle. By focusing on the most likely dominant frequency, our approach provides a more accurate and reliable analysis of the market's primary cycle, which can ultimately lead to more effective trading decisions.
Conclusion:
The Dominant Period-Based Moving Average Indicator, enhanced with the most likely dominant frequency approach, offers traders a powerful tool for exploiting market cycles. By adapting to the most frequent dominant period and focusing on the most likely dominant frequency, this indicator provides a more accurate and reliable analysis of the market's primary cycle. As a result, traders can make better-informed decisions, ultimately leading to improved trading performance. Incorporate the DPBMA Indicator into your trading toolbox today, and take advantage of the enhanced market analysis it provides.
Super 6x: RSI, MACD, Stoch, Loxxer, CCI, & Velocity [Loxx]Super 6x: RSI , MACD , Stoch , Loxxer, CCI , & Velocity is a combination of 6 indicators into one histogram. This includes the option to allow repainting.
What is MACD?
Moving average convergence divergence ( MACD ) is a trend-following momentum indicator that shows the relationship between two moving averages of a security’s price. The MACD is calculated by subtracting the 26-period exponential moving average ( EMA ) from the 12-period EMA .
What is CCI?
The Commodity Channel Index ( CCI ) measures the current price level relative to an average price level over a given period of time. CCI is relatively high when prices are far above their average. CCI is relatively low when prices are far below their average. Using this method, CCI can be used to identify overbought and oversold levels.
What is RSI?
The relative strength index is a technical indicator used in the analysis of financial markets. It is intended to chart the current and historical strength or weakness of a stock or market based on the closing prices of a recent trading period. The indicator should not be confused with relative strength .
What is Stochastic?
The stochastic oscillator, also known as stochastic indicator, is a popular trading indicator that is useful for predicting trend reversals. It also focuses on price momentum and can be used to identify overbought and oversold levels in shares, indices, currencies and many other investment assets.
What is Loxxer?
The Loxxer indicator is a technical analysis tool that compares the most recent maximum and minimum prices to the previous period's equivalent price to measure the demand of the underlying asset.
What is Velocity?
In simple words, velocity is the speed at which something moves in a particular direction. For example as the speed of a car travelling north on a highway, or the speed a rocket travels after launching.
How to use
Long signal: All 4 indicators turn green
Short signal: All 4 indicators turn red
Included
Bar coloring
Alerts

Volume Weighted Hull Moving Average Bollinger Bands (VWHBB)Title: "Volume Weighted Hull Moving Average Bollinger Bands Indicator for TradingView"
Abstract: This script presents a TradingView indicator that displays Bollinger Bands based on the volume weighted Hull Moving Average (VEHMA) of a financial asset. The VEHMA is a technical analysis tool that combines the reduced lag of the Hull Moving Average (HMA) with volume weighting to provide a more sensitive indicator of market trends and dynamics. The Bollinger Bands are a volatility indicator that plot upper and lower bands around a moving average, which can help traders identify potential trend changes and overbought or oversold conditions. The script allows the user to customize the VEHMA length and Bollinger Band deviation parameters.
Introduction: Bollinger Bands are a popular technical analysis tool used to identify potential trend changes and overbought or oversold conditions in the market. They are constructed by plotting upper and lower bands around a moving average, with the width of the bands determined by the volatility of the asset. The VEHMA is a variant of the Hull Moving Average (HMA) that combines the reduced lag of the HMA with volume weighting to provide a more sensitive indicator of market trends and dynamics.
Methodology: The VEHMA is calculated using a weighted average of two exponential moving averages (EMAs), with the weighting based on the volume of the asset and the length of the moving average. The Bollinger Bands are calculated by plotting the VEHMA plus and minus a standard deviation of the asset's price over a specified period. The standard deviation is a measure of the volatility of the asset and helps to adjust the width of the bands based on market conditions.
Implementation: The script is implemented in TradingView's PineScript language and can be easily added to any chart on the platform. The user can customize the VEHMA length and Bollinger Band deviation parameters to suit their trading strategy. The VEHMA, Bollinger Bands, and fill colors are plotted on the chart to provide a visual representation of the indicator.
Conclusion: The VEHMA Bollinger Bands indicator is a useful tool for traders looking to identify potential trend changes and overbought or oversold conditions in the market. This script provides a convenient and customizable implementation of the indicator for use in TradingView.

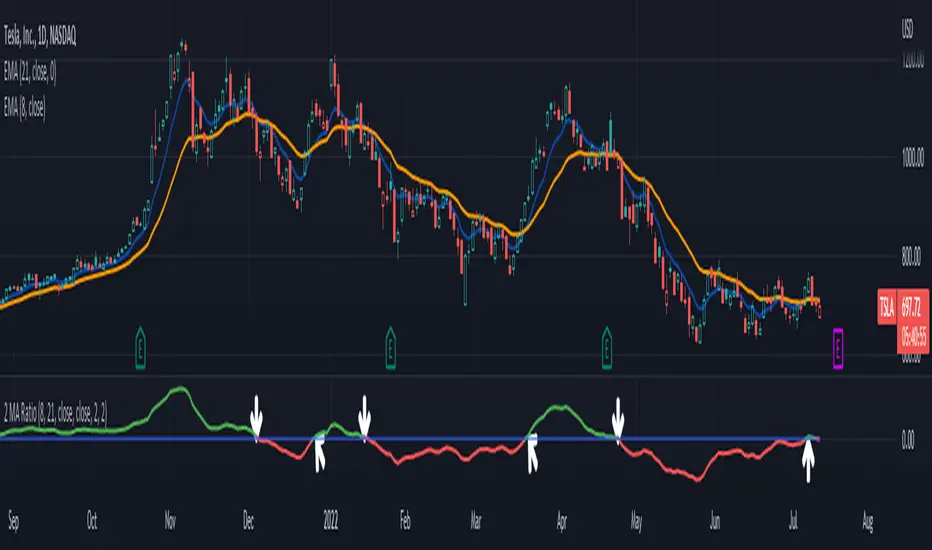
2 MA Ratio Can Help with Moving AveragesMany technical analysts use moving average crosses to assess trend changes. A faster-moving MA crossing above a slower-moving line may be viewed as a bullish signal. The opposite can apply to the downside.
While these methods may help analyze price direction, they can often force traders to wait until the cross occurs. Sometimes it may be useful to anticipate the event – or at least know it’s getting close.
That’s where the custom script 2 MA Ratio can be useful because it tracks the fast and slow moving averages. The fast MA is then shown as a percent of the slow MA. Positive readings indicate a bullish condition and vice versa for the negative.
It’s also color-coded to clearly illustrate when the crosses occur.
2 MA Ratio can handle simple moving averages (SMAs) and exponential moving averages (EMAs). It even lets you compare SMAs to EMAs. Users can choose between using open, high, low or closing prices as the inputs. (It defaults to Close.)
The chart above shows the short-term pair of the 8- and 21-day EMAs on Tesla (TSLA). The second chart below shows the same stock with the slower 50- and 200-day SMAs. Notice the “Golden Cross” last summer and the “Death Cross” in May:
TradeStation has, for decades, advanced the trading industry, providing access to stocks, options, futures and cryptocurrencies. See our Overview for more.
Important Information
TradeStation Securities, Inc., TradeStation Crypto, Inc., and TradeStation Technologies, Inc. are each wholly owned subsidiaries of TradeStation Group, Inc., all operating, and providing products and services, under the TradeStation brand and trademark. You Can Trade, Inc. is also a wholly owned subsidiary of TradeStation Group, Inc., operating under its own brand and trademarks. TradeStation Crypto, Inc. offers to self-directed investors and traders cryptocurrency brokerage services. It is neither licensed with the SEC or the CFTC nor is it a Member of NFA. When applying for, or purchasing, accounts, subscriptions, products, and services, it is important that you know which company you will be dealing with. Please click here for further important information explaining what this means.
This content is for informational and educational purposes only. This is not a recommendation regarding any investment or investment strategy. Any opinions expressed herein are those of the author and do not represent the views or opinions of TradeStation or any of its affiliates.
Investing involves risks. Past performance, whether actual or indicated by historical tests of strategies, is no guarantee of future performance or success. There is a possibility that you may sustain a loss equal to or greater than your entire investment regardless of which asset class you trade (equities, options, futures, or digital assets); therefore, you should not invest or risk money that you cannot afford to lose. Before trading any asset class, first read the relevant risk disclosure statements on the Important Documents page, found here: www.tradestation.com .
Moving Averages Different Type & SourceThis is a indicator to plot moving averages. User has the option to choose whether to plot SMA (simple moving average) or EMA (exponential moving average). Length of the averages also can be changed by user. The main feature also is use of different source for different length of MAs. Like you can plot 9SMA High with 20EMA Close etc. So, you can plot different types of combinations with type of MA (sma and ema) and Source type (high, low, open, close etc.).
A table also added in the right top to show the values of MA in selected timeframe. The red color indicate current price is below that ma and green color indicate current price is above that ma. Same feature added in plot of ma line by checking toggle color feature option on. It will show green color ma when price is above it and red color ma lines when price is below it.

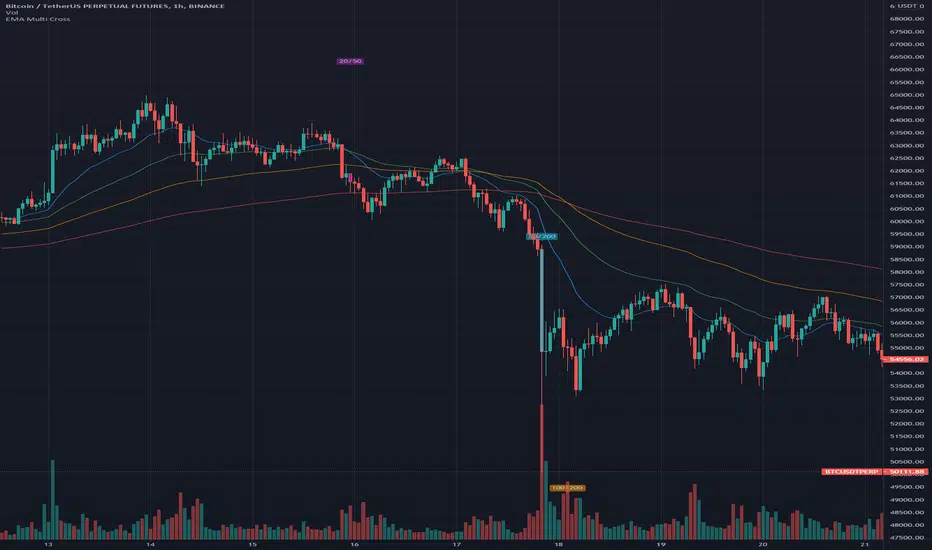
EMA Multi CrossThis is just a very simple EMA indicator that shows the 20, 50, 100, and 200 Exponential Moving Averages and plots some shapes when the lines cross from the 20 & 50, the 50 & 200, and the 100 & 200.
I know there are many EMA indicators out there, but I couldn't find one that let me edit the colors, values, and toggle the crossings. Maybe some of you will find usefulness in having some of these extra options too.
I use this occasionally on the Bitcoin 1 hour charts to see how the long-term trend is going.
Here are some ways to read EMA lines:
Slope: A rising moving average generally reflects a rising trend, while a falling moving average points to a falling trend.
Crosses: Seeing when a slower moving average crosses over/under a faster moving average can be an indication of a trend. If a shorter moving average remains above the longer moving average after they cross, the uptrend is considered intact. The trend is seen as down when the shorter moving average is below the longer moving average.
I prefer the slope of the two since crosses can cause some false positives if you are relying on it for trades.
Adam Khoo Moving AveragesThis indicator will plot the simple and exponential moving averages Adam Khoo is also looking at for buying opportunities.
The best timeframe to use this indicator is the daily chart . The weekly moving averages are hard coded and don't change on any other timeframe. The other moving averages will show the values of your current timeframe.
In the settings you have the option to change the values of the moving averages and to show or not show the current timeframe moving averages or the weekly moving averages.
A label will also show the current value of all moving averages. To hide this label, go into the settings and click on 'Style' and at the bottom uncheck 'Labels'.
Happy trading ;-)
Buy/Sell/Hold/Away? This script based on Simple Moving Average and Exponential Moving Average.
The Red Line is an exponential moving average with small length. It act as a main line.
The Black Line is an average of some past data of exponential moving average. Act as Trend Line
The green circles is an exponential moving average with medium length. It act as a signal line.
The Idea is, when the price move higher from it past,past,past, repeatedly in some duration, it will gain enough energy to fly to the highest.
Buy signal when red line cross down green circle. strong buy when red line cross down black line.
Sell signal when red line cross down green circle. strong buy when red line cross down black line.
Additional 1:
Triangle up(blue) indicate Buy Signal. it happen when the price break resistant with some condition and volume>1m
Triangle down(maroon) indicate Sell Signal. it happen when the price break support with some condition and volume>1m
The more triangle show in series, the strong the trend to move accordingly.
Additional 2:
Support and Resistance line.
Hope Benefit To You All.

21/55 EMA Cloud w/ Optional RibbonThis indicator behaves like a traditional EMA ribbon by using the 21, 25, 30, 35, 40, 45, 50, and 55 bar exponential moving averages. In this particular indicator, the traditional EMA ribbon lines are turned off by default leaving only a filled in area between the 21 and 55 bar averages. The filled in area is green when the 21 bar average is greater than the 55 and red otherwise. Additionally, the 9, 100, and 200 exponential moving averages are available for reference.

Overbought or Oversold? Check Distance From MAMoving averages are one of the most basic tools for technical analysts. They can be useful for both trend analysis and for mean reversion.
But how can you know when price is historically overbought or oversold relative to a moving average? Distance from MA can help.
This indicator calculates the distance from a moving average as a percentage and plots the result as an oscillator. Values above 0 appear in green, while negative readings are colored red.
This chart highlights the depth of the S&P 500's recent selloff. As you can see, the close dipped to 25 percent below its 50-day SMA on Monday. That was its most oversold condition since November 20, 2008 -- in the middle of the subprime financial crisis.
Distance from MA can handle five types of moving average. Simply change the "AvgType" input according to this key:
1 - Simple Moving Average
2 - Exponential Moving Average
3 - Hull Moving Average
4 - Weighted Moving Average
5 - Volume-Weighted Moving Average

Fast/Slow Degree OscillatorIntroduction
The estimation of a least squares moving average of any degree isn't an interesting goal, this is due to the fact that lsma of high degrees would highly overshoot as well as overfit the closing price, which wouldn't really appear smooth. However i proposed an estimate of an lsma of any degree using convolution and a new sine wave series, all the calculation are described in the paper : "Pierrefeu, Alex (2019): A New Low-Pass FIR Filter For Signal Processing."
Today i want to make use of this filter as an oscillator providing fast entry points. The oscillator would be similar to the MACD in the sense that is consist on the difference between two filters, with one faster than the other, however unlike the MACD which use two moving averages of different length, here i'll use two filters of same length but different degrees.
The Indicator
The indicator consist in 3 elements, one main line (in green) the trigger line (in orange) and the histogram which is the difference between the green line and the red one. The main line is made from the difference between two filters of both period length and different degrees (fast, slow), fast should always be higher than slow. The signal line is just the exponential moving average of the main line, the period of the exponential moving average can be adjusted from the settings.
Both fast/slow determine the degree of the filters, higher values will create a faster filter.
For those who are curious, the filter use a kernel who estimate a polynomial function, this is how an lsma work, the kernel of an lsma of degree p is a polynomial of degree p . I achieved this estimation using a sine wave series.
When fast = 1 and slow = 0, the oscillator appear less periodic, this equivalent to : lsma - sma
Using 2/1 allow the indicator to highlight cycles more easily without being uncorrelated with the price. This is equivalent to qlsma - lsma, where qlsma is a quadratic least squares moving average. This is similar to my old indicator "Linear Quadratic Convergence Divergence Oscillator".
By default the indicator use 3 for fast and 2 for slow, but you can increase both values, here 4/3 :
In general higher values of fast/slow will create way more cyclical results, but they can be uncorrelated with the market price.
Conclusion
This indicator was rather made to show the filter calculation rather than proposing something interesting. However it can be funny to see how the difference between low lag filters create more cyclical outputs, it often allow indicators to have more predictive capabilities.
I invite you to read the paper made about the filter, codes for both pinescript and python are provided.
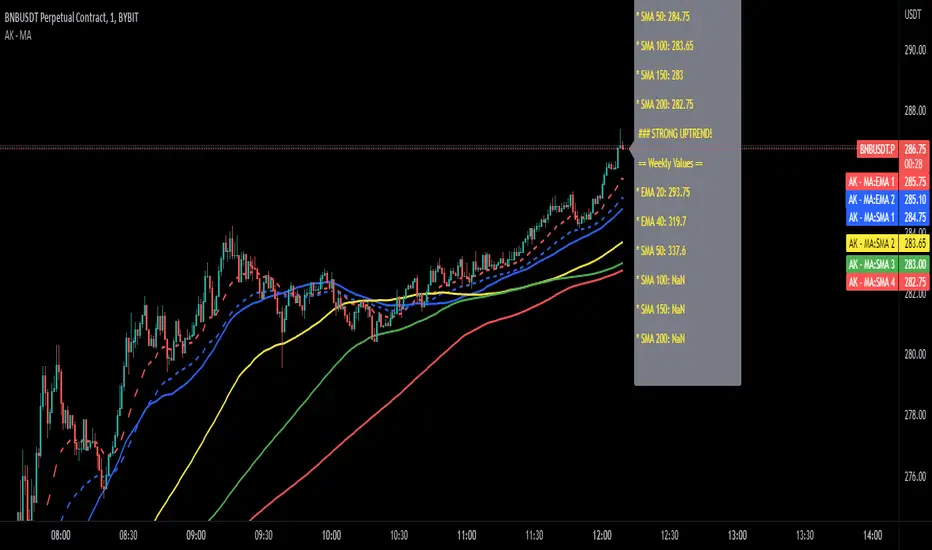
All Moving averagesI have added an option to turn on or off any Moving average by choice and if needed, Heikin-ashi used as source (instead of close)
List of Moving Averages which you can use
T3 - Tillson Moving Average
DEMA - Double Exponential Moving Average
ALMA - Arnaud Legoux moving average
LSMA - Least Squares Moving Average
MA - Simple Moving Average
EMA - Exponential Moving Average
WMA - Weighted Moving Average
SMMA -The Smoothed Moving Average
TEMA - triple exponential moving average
HMA - The Hull Moving Average
AMA - Adaptive Moving Average
FAMA - Fractal Adaptive Moving Average
VIDYA - Variable Index Dynamic Average
TRIMA - Triangular Moving Average
Consider a tip in ETH to
0xac290B4A721f5ef75b0971F1102e01E1942A4578
Thank you and have a nice day
CryptoJoncis
Awesome Moving AveragesThis script allows you to add up to four simple and exponential moving averages the the chart instead of adding 4 simple moving averages and 4 exponential moving averages individually.
The stronger lines are SMA's and the thinner lines are EMA's.
White - "1st SMA" and "1st EMA"
Green - "2nd SMA" and "2nd EMA"
Blue - "3rd SMA" and "3rd EMA"
Red - "4th SMA" and "4th EMA"
You can modify which moving averages are visible on the chart and also modify the period of the moving averages.
There are four periods which you can edit - each period applies to a pair of moving averages (a pair of SMA and EMA). For example: "1st MA Length" option applies to "1st SMA" and "1st EMA" etc.
ibb.co
In addition to that Awesome Moving Averages script allows you to keep the daily moving averages resolution on intraday charts.
For example - here we have only "1st SMA" and "1st EMA" enabled and we are viewing a daily chart:
Now if we have "Keep Daily MA Resolution On Intraday Periods" option enabled we would see the daily moving averages (SMA and EMA) on intraday periods. Here we are viewing a 4h chart:
If you disable this option you would see the moving averages on intraday charts with the intraday MA lengths as you expect:
"Visible MA's On Intraday Periods" option allows you to choose which MA's you would like to be visible on intraday charts if the "Keep Daily MA Resolution On Intraday Periods" option is enabled.
If you have any thoughts or ideas on how to improve the "Awesome Moving Averages" script then let me know!

4 Time Frame Two EMAs Ribbon Comparison - Tom1traderI had seen something like this on metatrader but not here. Since I use TradingView and not metatrader had some fun with this. Indicates up or down for 4 chosen time Frames and as such helps to see the historical trend. Works best on daily or shorter charts because of load time.
User can choose the length of the two exponential moving averages used on each time frame or use defaults 9 and 15.
User can choose the 4 time frames defaults are (display from top to bottom) 5, 15, 60 and D.
Displays a column of 4 dots or circles for each bar of current chart the top being the shortest time frame.
If the faster exponential moving average is above the slower (uptrend) the dot is green else red.
This is similar (actually what I was originally shooting for but took extra time to figure out time frames on here) to another script of mine that has the same display method but uses a spaced set of Hull Moving Averages on one time frame, you choose the shortest length and the space increment between the averages. One may work better than the other for different markets or trading styles. The other one is here: Have fun trading and keep smiling!
